Applications Overview
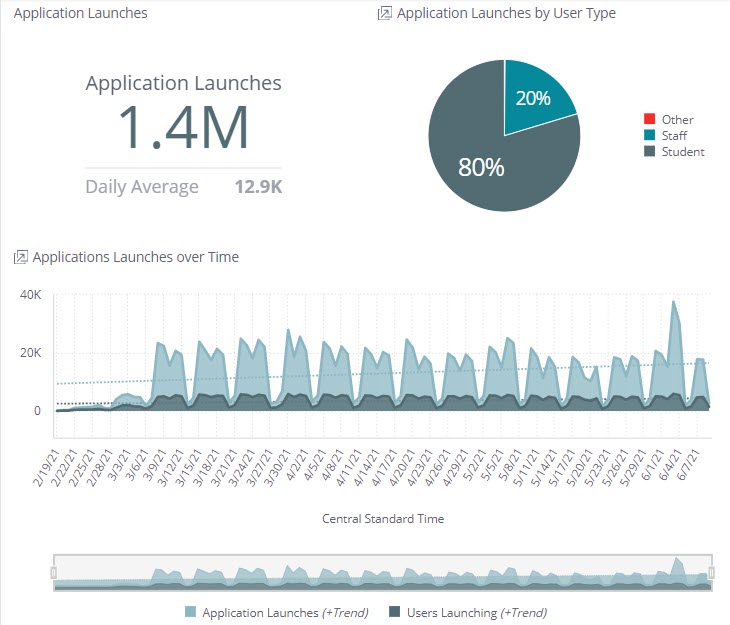 |
The Applications Overview page has three separate widgets to provide data regarding the applications launched, who is launching them, and how frequently they are launched per week.
Application Launches
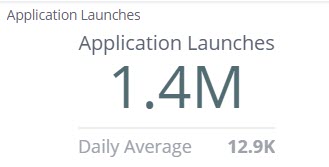 |
The Application Launches widget does not have Jump-To or Drill-Down options, and simply displays the number of launches performed within the defined time period. The secondary value for this widget averages the number of overall launches by the number of days in the defined time period and shows the daily average for that number.
Application Launches by User Type
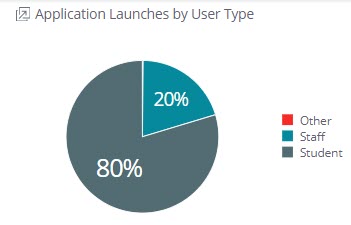 |
This pie chart widget breaks down the percentages of application launches by user type. Left-click on any wedge to filter the dashboard by that user type, or right-click the desired section to Drill Down with filters or Jump-To the Launch Detail for that user type.
Application Launches by User Type - Jump-To Dashboard
 |
This Jump-To Dashboard shows the top 15 applications launched by the selected user type and the bottom 15 applications launched by that user type. The bottom 15 applications are calculated by showing the top 15 applications that are launched by user types other than the one selected. Both charts are filterable with the filters in the right column for a more focused look at the data you want to view.
Application Launches Over Time
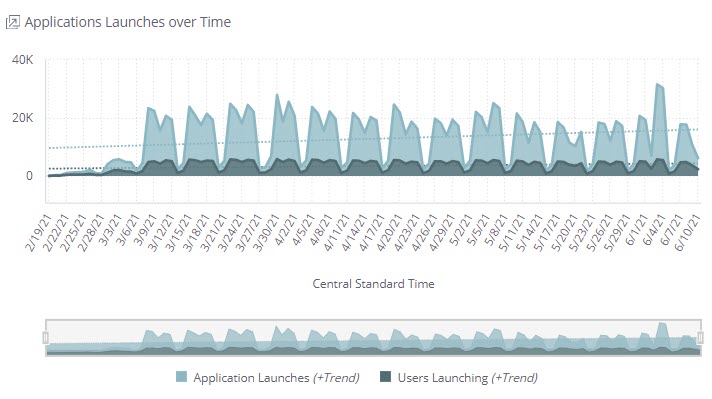 |
The primary trendline chart on this widget shows the number of applications launched per day over a period of time. Right-clicking any point on the top chart will provide Drill-Down options to adjust the time increments, Application Name, School Type or Name, Grade Level, and Full Name. The Daily Launch Detail Jump-To Dashboard is also available from this menu.
Daily Launch Detail Jump-To Dashboard
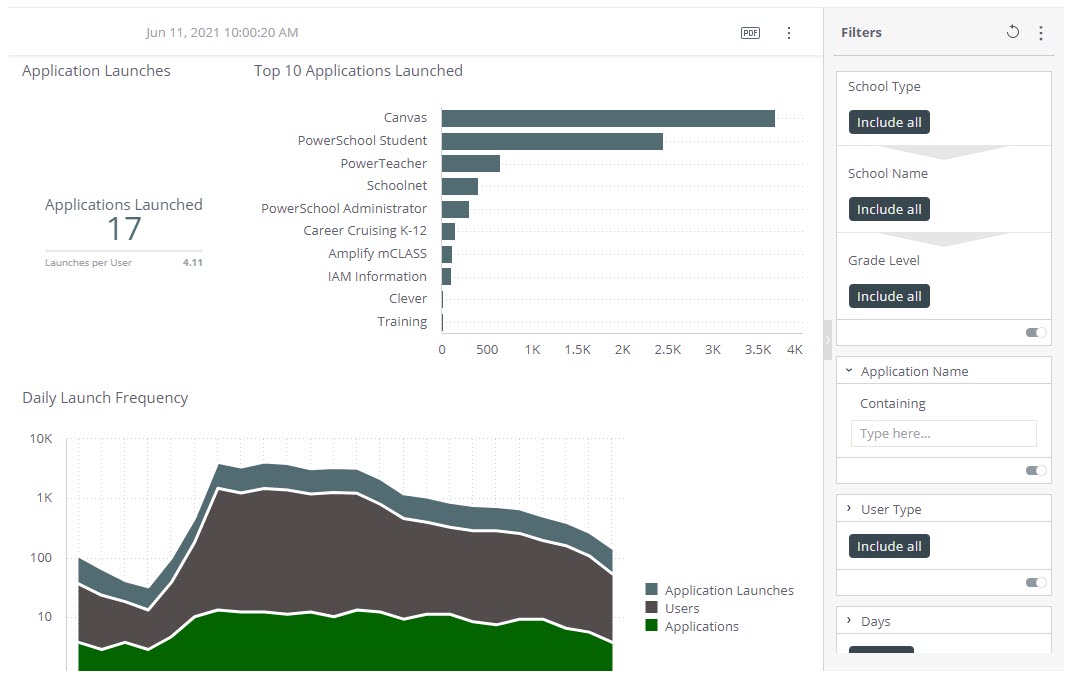
This screen provides three graphs to represent data trends of application launches and frequency.
Application Launches
 |
This widget's primary value displays the number of applications launched within the existing filters and settings, and the secondary value breaks out the launches per user for this data. There are no Jump-To Dashboards or Drill-Down capabilities for this widget.
Top 10 Applications Launched
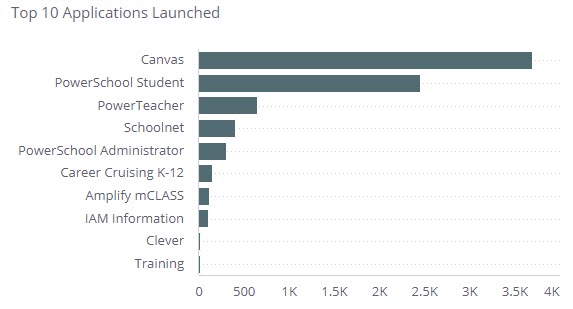 |
This widget displays the Top 10 Applications Launched. The different applications are tracked for system launches, and the cumulative amount is shown in this bar chart. Left-clicking any of the bars will filter the rest of the Jump-To Dashboard based on the selected application for more focused data on the other widgets for a specific application.
Daily Launch Frequency
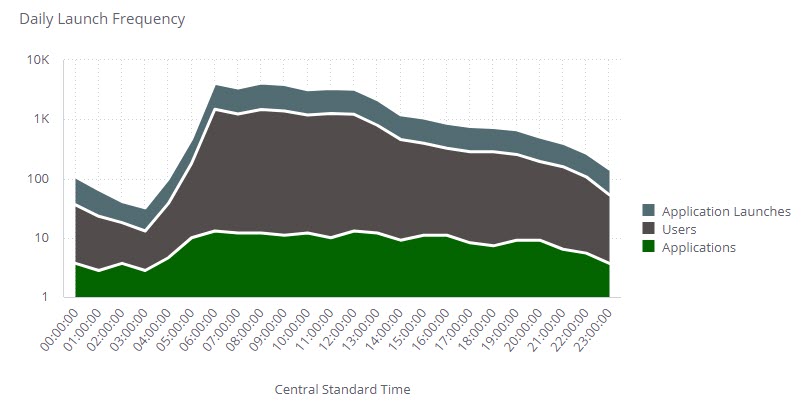 |
The Daily Launch Frequency trendline breaks down application launches by users, applications, and application launches. This widget shows the trendlines and the relationship between each element being reported. The filters in the right column can break down the content in this chart even further if needed. There are Drill-Down options to focus on School Type or Name, the Increments to be shown, Grade Level, and Full Name. The Day filter can also be used to change the date within the same screen.