Dashboard Navigation & Expected Behavior
The Insights dashboards have commonalities among them as they break down the data pulled for analysis in several different views.
Navigating Dashboard Widgets
There are multiple styles of charts used in the Insights dashboards. These are the most commonly used widget types found in the RapidIdentity Insights module.
Indicator Widgets
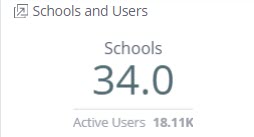
These widgets display a primary and a secondary value, calculating a specific total and average for an important data point. These can be clicked to access a Jump-To Dashboard with more data breakdowns and filter capabilities. The entire dashboard can be downloaded as a .csv or .png file from the kebab menu on the main header, or individually.
Pie Charts
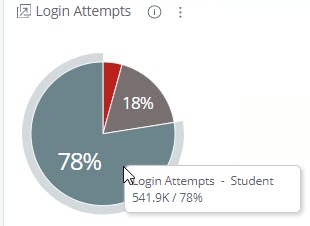
Pie charts can be used to filter the rest of the widgets on the screen by clicking on the preferred section. The sections are identifiable by hovering over each color and reading the hovertext. Right-clicking a section will also provide a Drill-Down menu with access to a Jump-To Dashboard.

To download a pie chart as an Image or CSV file, click on the kebab menu at the top right of the widget and choose the preferred download format.
Note
Clicking on the pie chart as a filter, then clicking back to normal will wipe the default filters if set. These will need to be refreshed for the default filters as applicable.
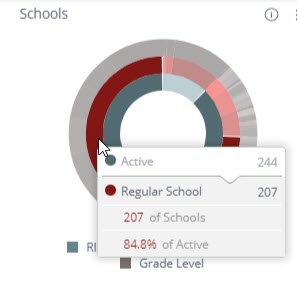
Starburst Widgets
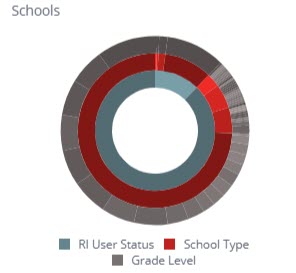 |
Starburst widgets do not have drill-down or filtering capabilities, but hovering over a certain section will display more details about that section,
 |
Bar Charts
There are two types of bar charts used within RapidIdentity Insights: Horizontal and Vertical.
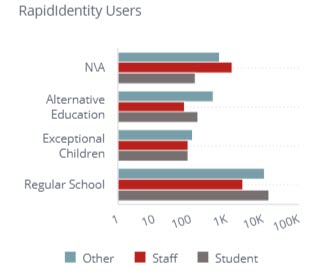 |
Horizontal bar charts are grouped into relevant categories for that data. Clicking a bar in a group will filter the rest of that dashboard by that category, and right-clicking any bar provides the option to drill into more specific filters.
 |
Vertical bar charts typically represent one specific data point per bar, and within that have different aspects of measurement. Clicking any bar will filter the rest of the dashboard by that data for more focused displays of that particular data set. Each bar also has a drill-down option for further filtering. In some vertical bar charts, clicking on a bar will provide a secondary breakdown of the data within that bar's data set.
Trendline Charts
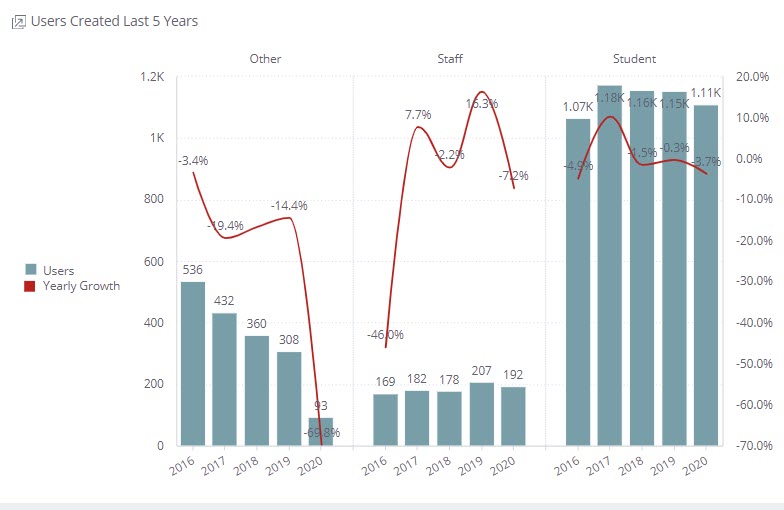 |
Trendline charts are a combination of data represented in a bar format and trendlines represented within those bars. Right-clicking the bars will access a Drill-Down menu with a Jump-To Dashboard,
Pivot Tables
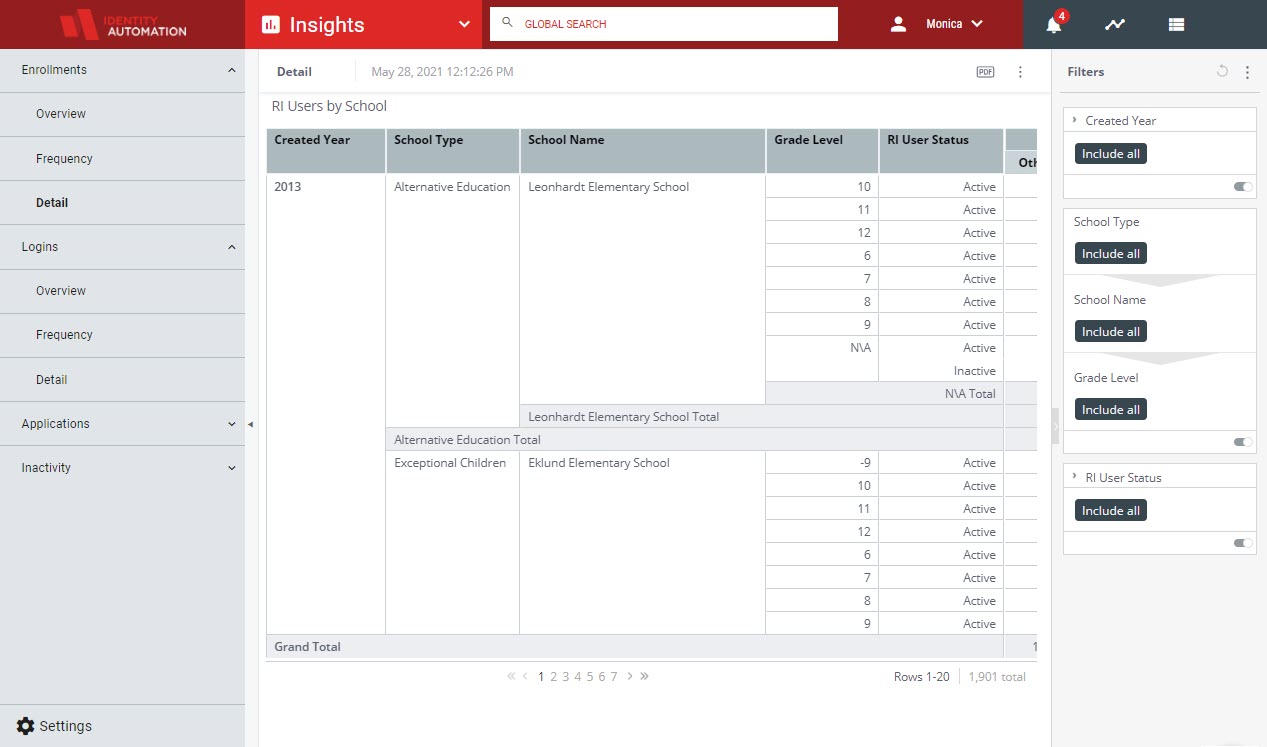 |
The pivot tables show up in some of the menus and are filterable by the options in the Filters panel. There are multiple drill-down capability on these, and they can be saved as a .pdf or a .png with preserved filters and sizing options before saving.
Drill-Down Capabilities and Filters
Most types of widgets (except Indicator Widgets and Starbursts) have the ability to right-click to a Drill-Down menu that contains further filters and occasionally a Jump-To Dashboard.
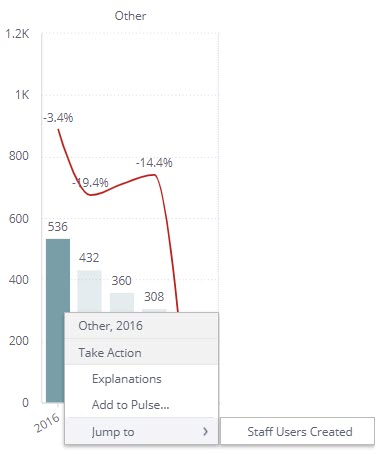 |
Jump-To Dashboards from this menu are more granular breakdowns of the selected data set, and are usually presented in a different format from the widget that originated it.
Icons
There are multiple icons with various functionalities that will assist viewers with discovering more information on each widget, chart, or pivot table. These are defined below.
Icon | Icon Type | Description |
|---|---|---|
 | Options | This menu provides multiple options that differ slightly depending on widget type. The one consistent option across all widget types is Download. This allows viewers to download dashboards as .pdf, .png, or .csv files. NoteDownload formatting depends on widget type. Only Charts and Pivot tables can be downloaded as .csv files, while Indicator widgets and dashboards can be downloaded as .pdf files. |
 | Enlarge | Enlarge the widget to full screen. To return to the dashboard, simply use the browser's Back button. |
 | Information | Hover over or click this icon to view a short summary of that widget's purpose and content. |
 | Download as PDF | Click this to create a .pdf file of the full dashboard with any filters applied. |
 | Jump-To Dashboard | This indicates that the associated widget is clickable to view more granular data points about the widget's content. For Indicator Widgets, simply click within the widget wherever the mouse selection icon ( NotePie charts can be right-clicked to drill-down, or left-clicked to filter the onscreen data by that particular setting. For Charts and Pivot Tables, the Jump-To dashboard is available by right-clicking a data point and choosing Jump To... then selecting the secondary dashboard of interest. |
 | Exploration Paths | These are only available on Indicator widgets and are powered by algorithms that uncover statistically powerful insights and surface them via new, automatically created widgets. |
