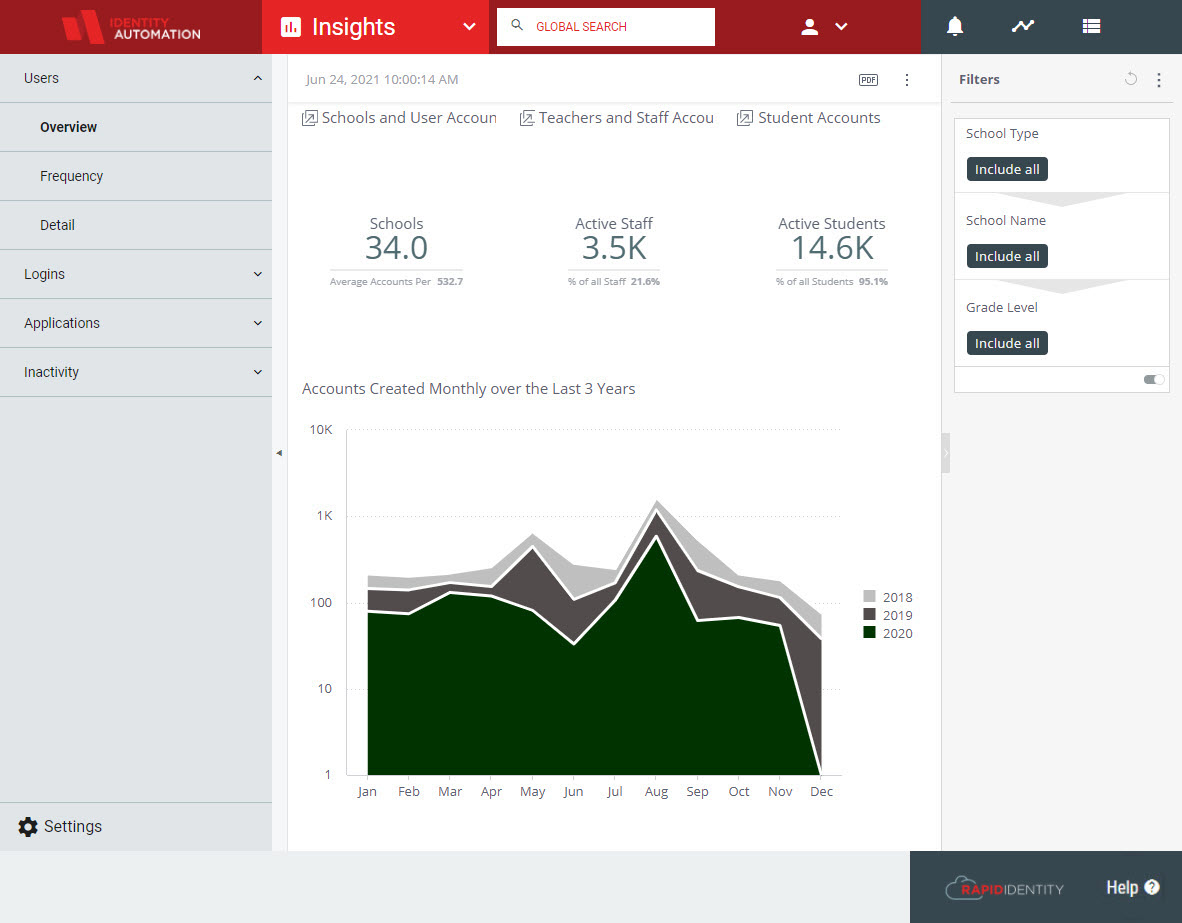
Users Overview
The Users Overview displays four widgets that provide insight into total enrollments and breakdowns of enrollments by Created Year, School Type, School Name, and Grade Level. Each widget on this page has a Jump-To Dashboard upon clicking.
 |
Schools and User Accounts
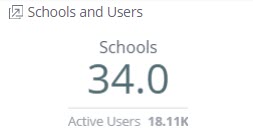 |
The Schools and Users widget displays the primary value of how many schools are active within RapidIdentity, and below is the secondary value of the total number of accounts per school. Click this widget to access a Jump-To menu with further breakdowns of this data.
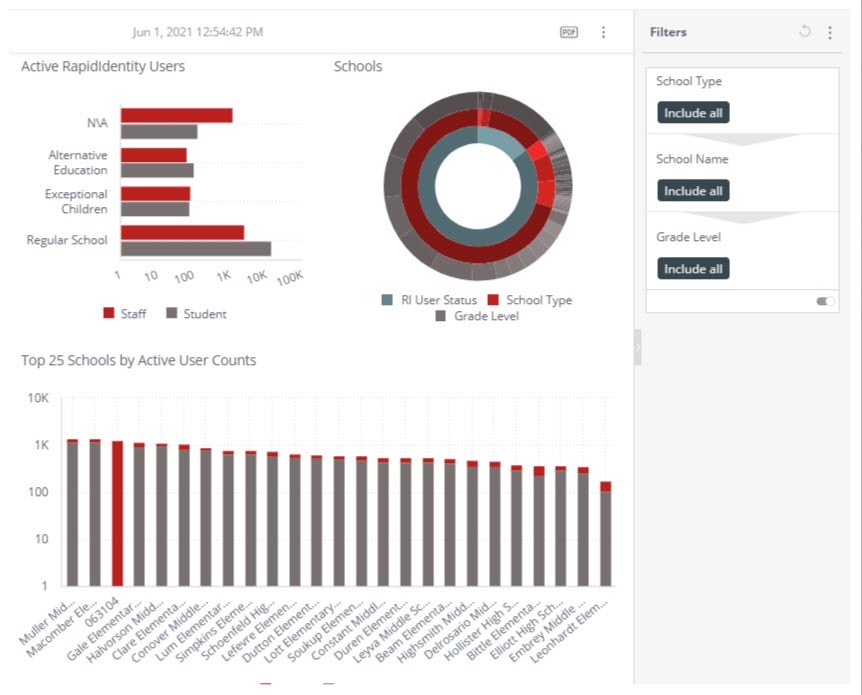 |
Each bar chart's data point can be clicked to filter the rest of the widgets by that data point for a more focused view of the different charts. To remove the filter, simply go to the Filters column at the right and clear the existing filter back to Include All. Sunburst widgets are not drill-able. To leave this view, click outside of the Jump-To dashboard and return to the main menu.
Teachers and Staff Accounts
 |
The primary value for this widget displays the number of Active Staff (Users that are categorized as Teachers or Staff / Non-Teachers, but not Students) that are currently active within the system. The secondary value shows what percentage of all staff is represented by the Active Staff number. Click this widget to access a Jump-To Dashboard for this data.
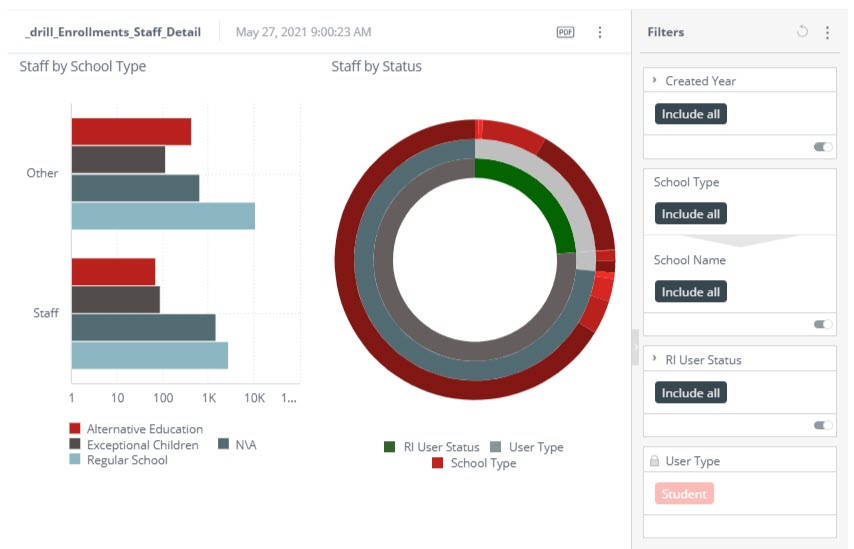 |
Staff by School Type bar charts show the number of user types by school types. Clicking on any bar will filter the entire dashboard based on the bar chosen.
Note
When the same bar is clicked to return to this screen, the User Type filter is cleared. Click the Reset button ( ) at the top of the Filters menu to restore the settings to default.
Student Accounts
 |
The primary value for this widget is the number of Active Students within RapidIdentity. The secondary value displays the percentage that the active students represent within all student accounts. Click this area to see a breakdown of this data.
 |
These two charts can be hovered over for more information on Students by Grade by School Type or Students by Status by the Top 12 Grade Levels. The bar chart can be drilled into to filter the chart by School Type, School Name, or Full Name (of the Student). Hover over sections in the Sunburst chart for more information on each data point.
Note
Unlike many bar charts, this specific one will provide the Drill-Down menu on a left-click and will not respond to a right-click.
Accounts Created Monthly over the Last 3 Years
 |
The final widget on the Users Overview page displays the number of accounts created in each month over the last three years. These are displayed in 12-month breakdowns by month and year with the years color-coded into each area. Clicking any of the trendlines will provide a solitary chart with just the information for that specific month over the last 3 years, and there are some drill-down options available for filtering this chart.