Logins Overview
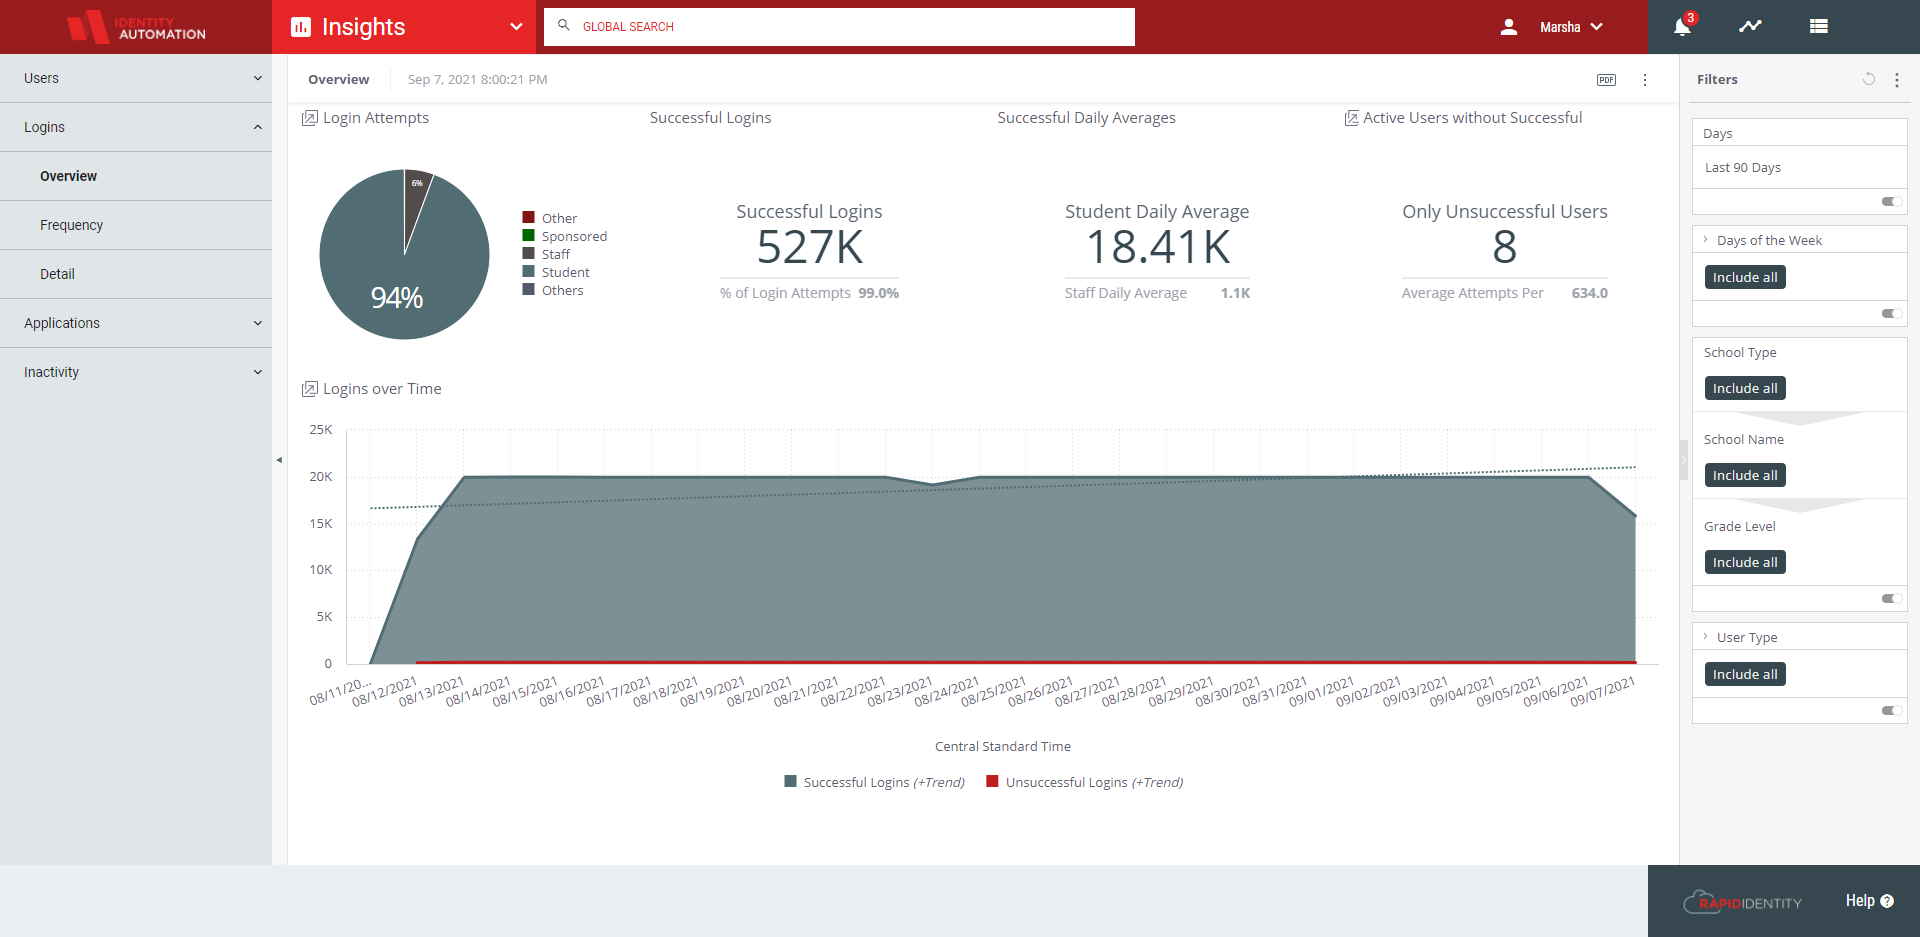 |
The Logins Dashboard provides an overall view of Successful and Unsuccessful Logins, along with a breakdown of each by user type, as well as a Logins Over Time trendline.
Login Attempts
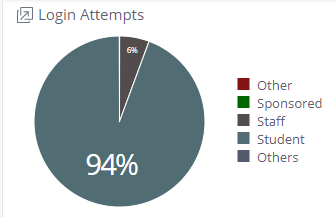 |
The Login Attempts pie widget counts the total number of login events categorized by user type and displays the percentage of each category. This can be filtered by the Filters option on the right sidebar, or you can click a section to filter the entire dashboard by that particular metric.
Right-clicking any of the sections will give you the option to go to a Jump-To Dashboard for the selected user type.
Login Detail Jump-To Dashboard
 |
Last Successful Student/Staff/Other Logins
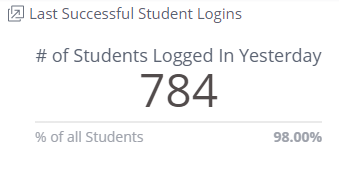
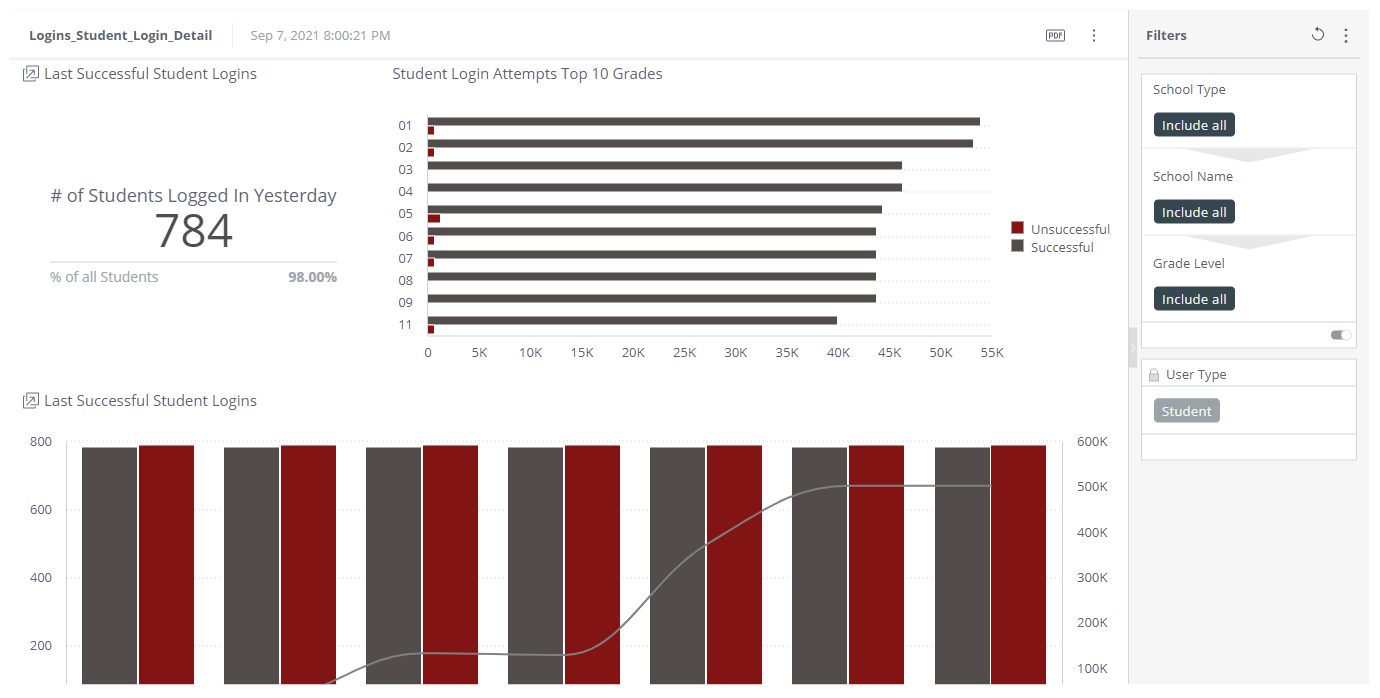
The first widget in this Jump-To dashboard displays the number of users (Students, Staff, or any of the other user types available in the preceding pie chart) that were able to log in yesterday. Its secondary value shows the percentage of all of those types of users that the number represents.
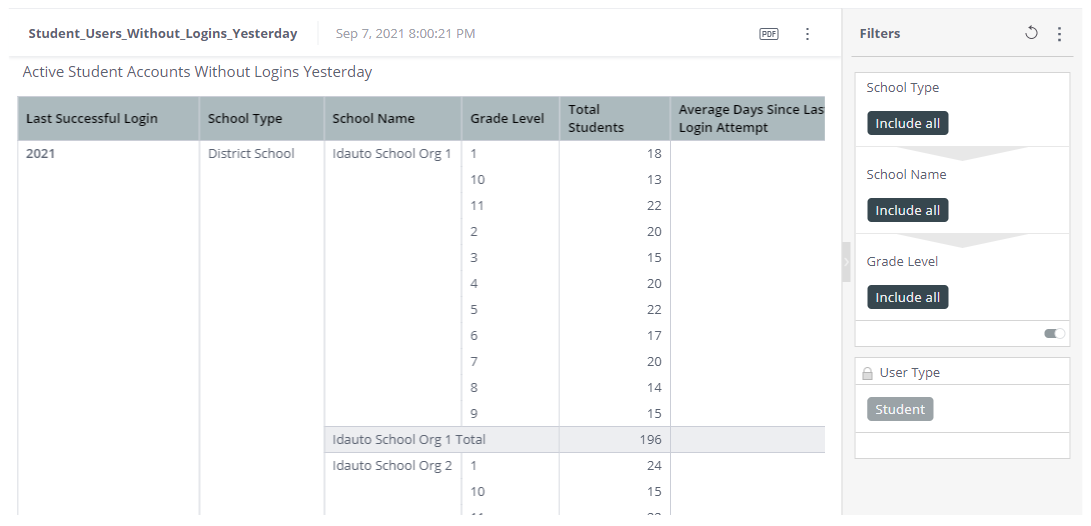
The Jump-To Dashboard for this widget provides a table that breaks down the details about the users of the selected type and data regarding their previous login attempts.
 |
Top 10 Student/Staff/Other Logins
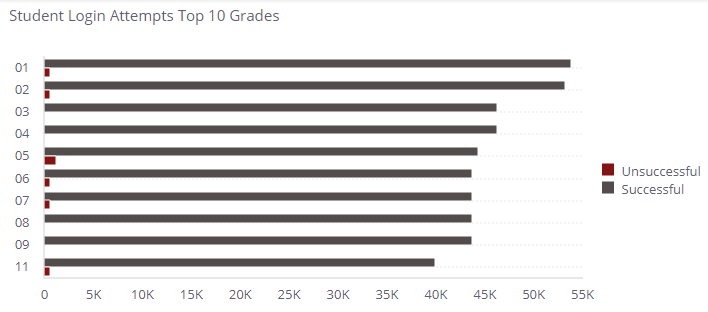
This shows the top 10 Successful and Unsuccessful logins for whichever user type has been chosen. This can be used to filter the rest of the widgets in the Jump-To Dashboard by clicking on a specific user, school, or grade. Both Successful and Unsuccessful logins are included in this bar chart.
Last Successful User Logins

The last widget in this Jump-To Dashboard displays columns for successful logins and login attempts per defined period of time along with a trendline of total user login attempts per period. Drill-down options for this chart include multiple filters that can be used to alter the appearance and display of the chart to show the data in the preferred time increments or School Type or name and Full Name or IP Address of any particular user within the chosen category.
Note
These values are based on the single date of the last successful login for that user and are not cumulative. A user whose last successful login was this week but did not have a successful login yesterday will not show up in Yesterday's count, etc.
Successful Logins
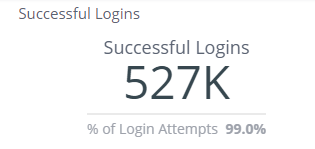 |
This widget simply displays the number of total Successful Logins within the time restraint provided in the right column filters. The secondary value shows the percentage of successful logins within all login attempts as specified by the filters. There is no Jump-To Dashboard or Drill-Down functionality associated with this widget.
Successful Daily Averages
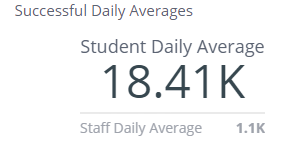 |
The Successful Daily Averages widget shows the average of Student Daily Logins as its primary value and the average of Staff Daily Logins as its secondary value. There is no Jump-To Dashboard or Drill-Down functionality associated with this widget.
Active Users without Successful Logins
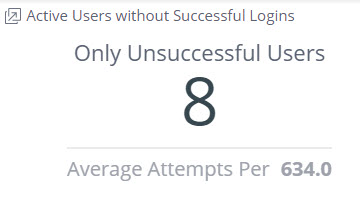 |
This widget's primary value shows the number of accounts marked as Active that have never had a successful login. The login attempts for these users are shown as the secondary value. This widget does have a Jump-To Dashboard with more granular information about this data.
Active Users Without Successful Logins Jump-To Dashboard
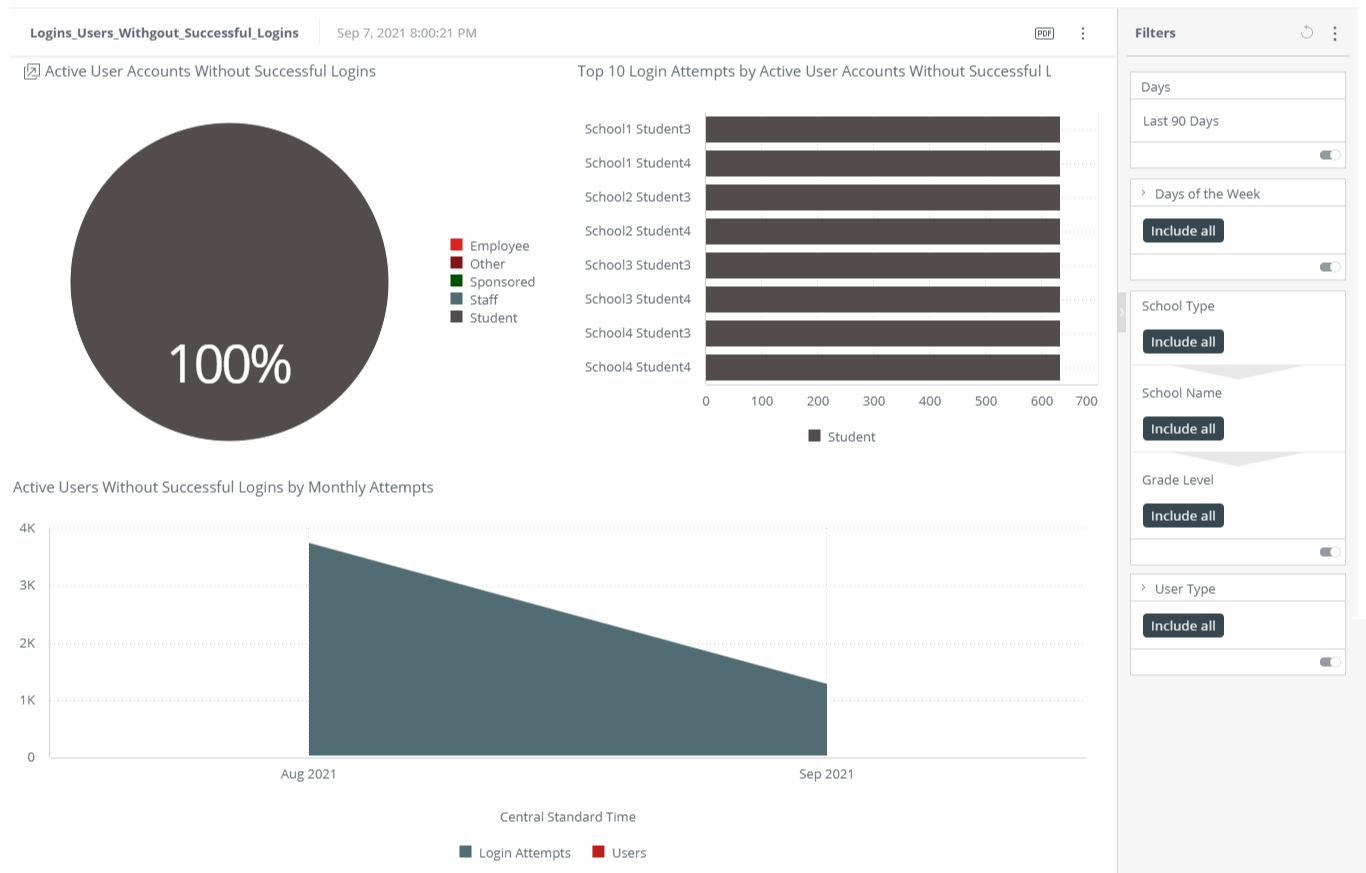 |
This Jump-To Dashboard has three separate widgets within it to more granularly investigate this category.
Active User Accounts Without Successful Logins
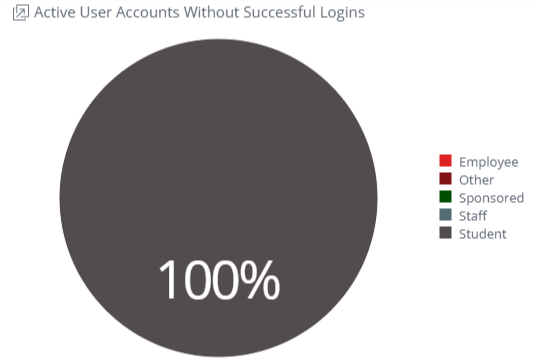
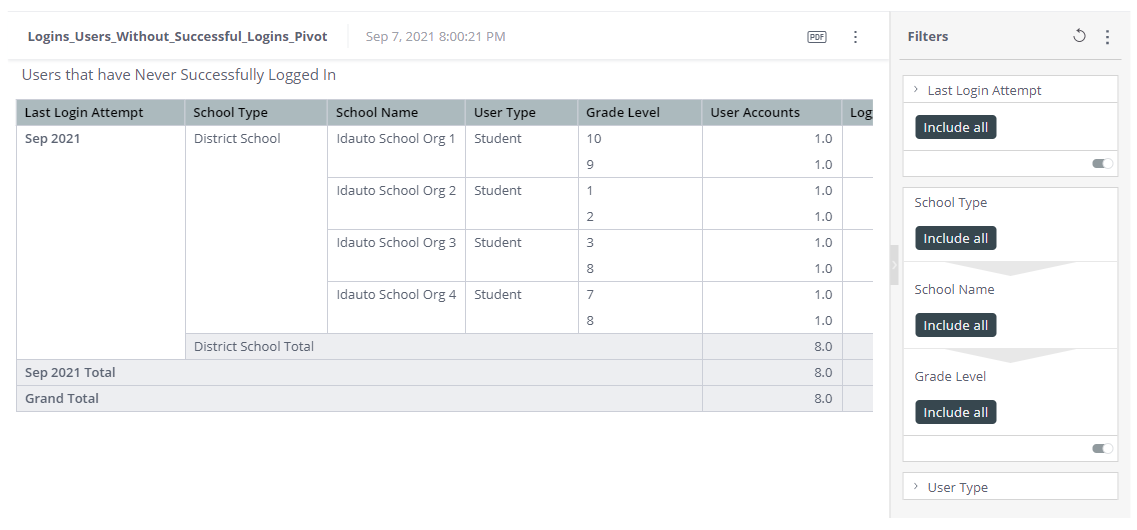
This pie chart displays the percentage of each Active user type (Staff or Student) without successful logins. Clicking on either section will filter the rest of the charts on the Dashboard, and a Jump-To dashboard is available by right-clicking any of the sections to display a Pivot table showing the number of staff or students per school that have never logged into the system, depending on which section of the pie chart is right-clicked. This chart can be filtered by any of the choices in the right column.
Top 10 Login Attempts by Active User Accounts Without Successful Logins
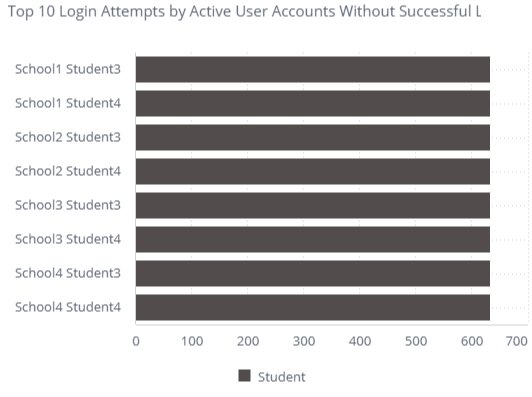 |
This widget displays the top 10 users who have been attempting to log in but still cannot. The bars mark the number of attempted unsuccessful logins per user. Click each user to filter the rest of the dashboard to that one user's data.
Active Users Without Successful Logins by Monthly Attempts
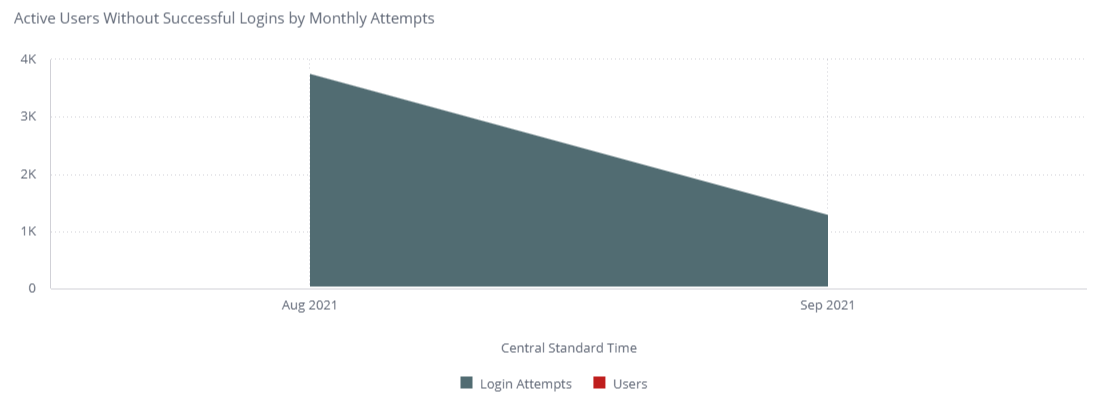 |
The final widget on this jump-to Dashboard displays Active Users who have been attempting to log in over the time period that is defined in the filter but grouped by Month with trendlines between. This divides the view between Login Attempts and Accounts by color to display the bulk of attempts or accounts with unsuccessful logins.
Logins Over Time
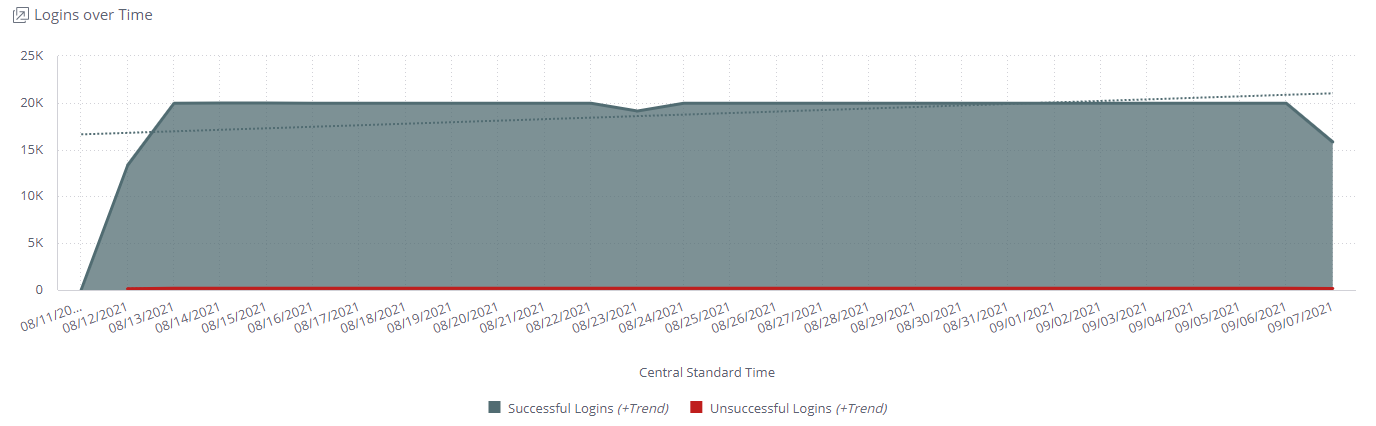 |
The final widget on the Logins Overview page shows the number of logins – successful and unsuccessful – over time based on the time restraints set in the right column filter. This widget has a Jump-To Dashboard associated with it with three more widgets to break down this data visually determined by the day right-clicked from the main chart.
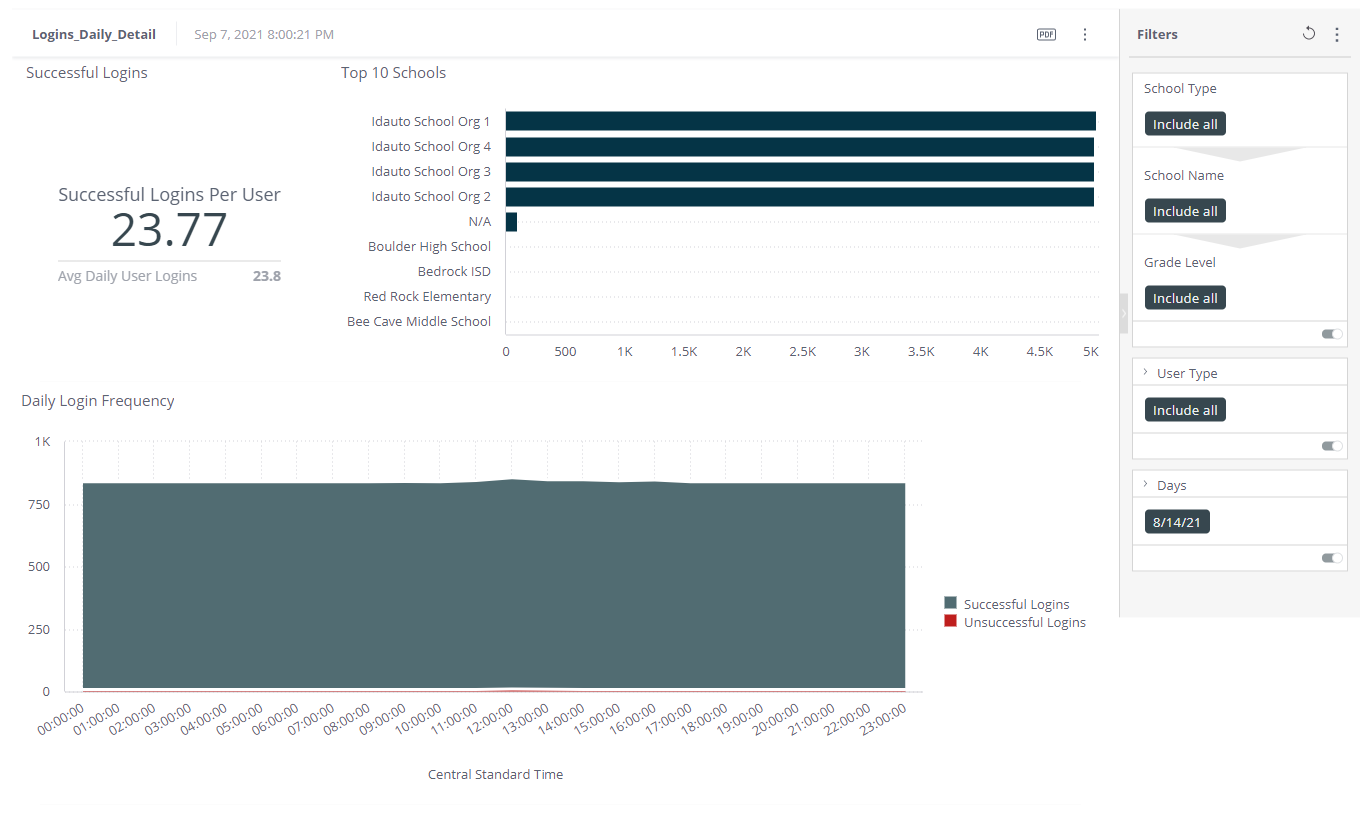
Successful Logins
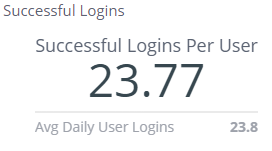 |
The Successful Logins widget displays as its primary value the number of successful logins per user depending on the day selected. The secondary value is the average of daily user logins for the day selected. There are no Jump-To Dashboards or Drill-Down options on this widget.
Top 10 Schools
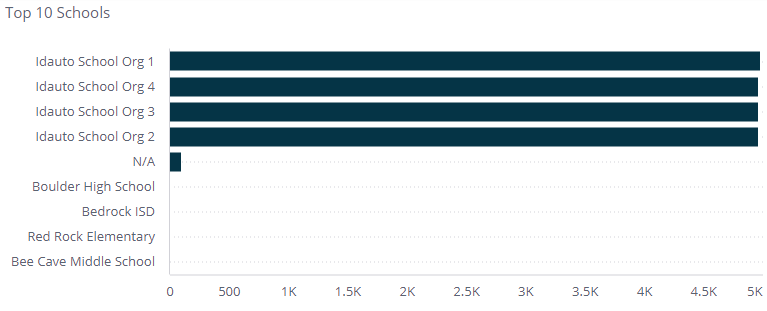 |
The Top 10 Schools bar graph displays the top schools with successful logins and displays the number of those logins. Clicking a bar will filter the rest of the dashboard by that school's data set. Each bar can be drilled into and filtered by Grade Level or Full Name.
Daily Login Frequency
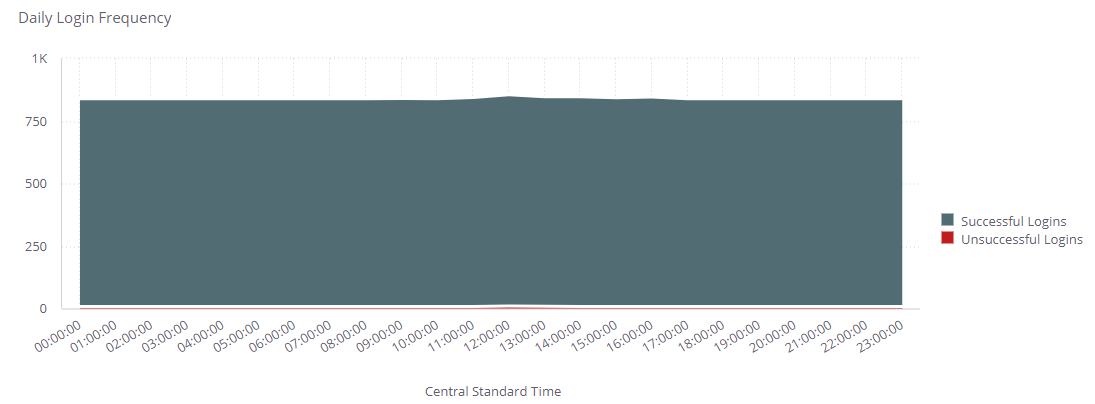
The Daily Login Frequency widget shows what time each login attempt has been made for the selected day, and how many are successful or unsuccessful at that hour mark. There is no Jump-To Dashboard for this widget, but it is possible to drill into each data point and see the data in 30-, 15-, or 1-minute increments as desired.